Prime Minister Liz Truss's reluctance to raise benefits to match the rising cost of living is causing a rift within the Conservative Party. Cabinet minister Penny Mordaunt says it "makes sense" to increase them in line with inflation.
So what are the main benefits and have they kept up with rising prices?
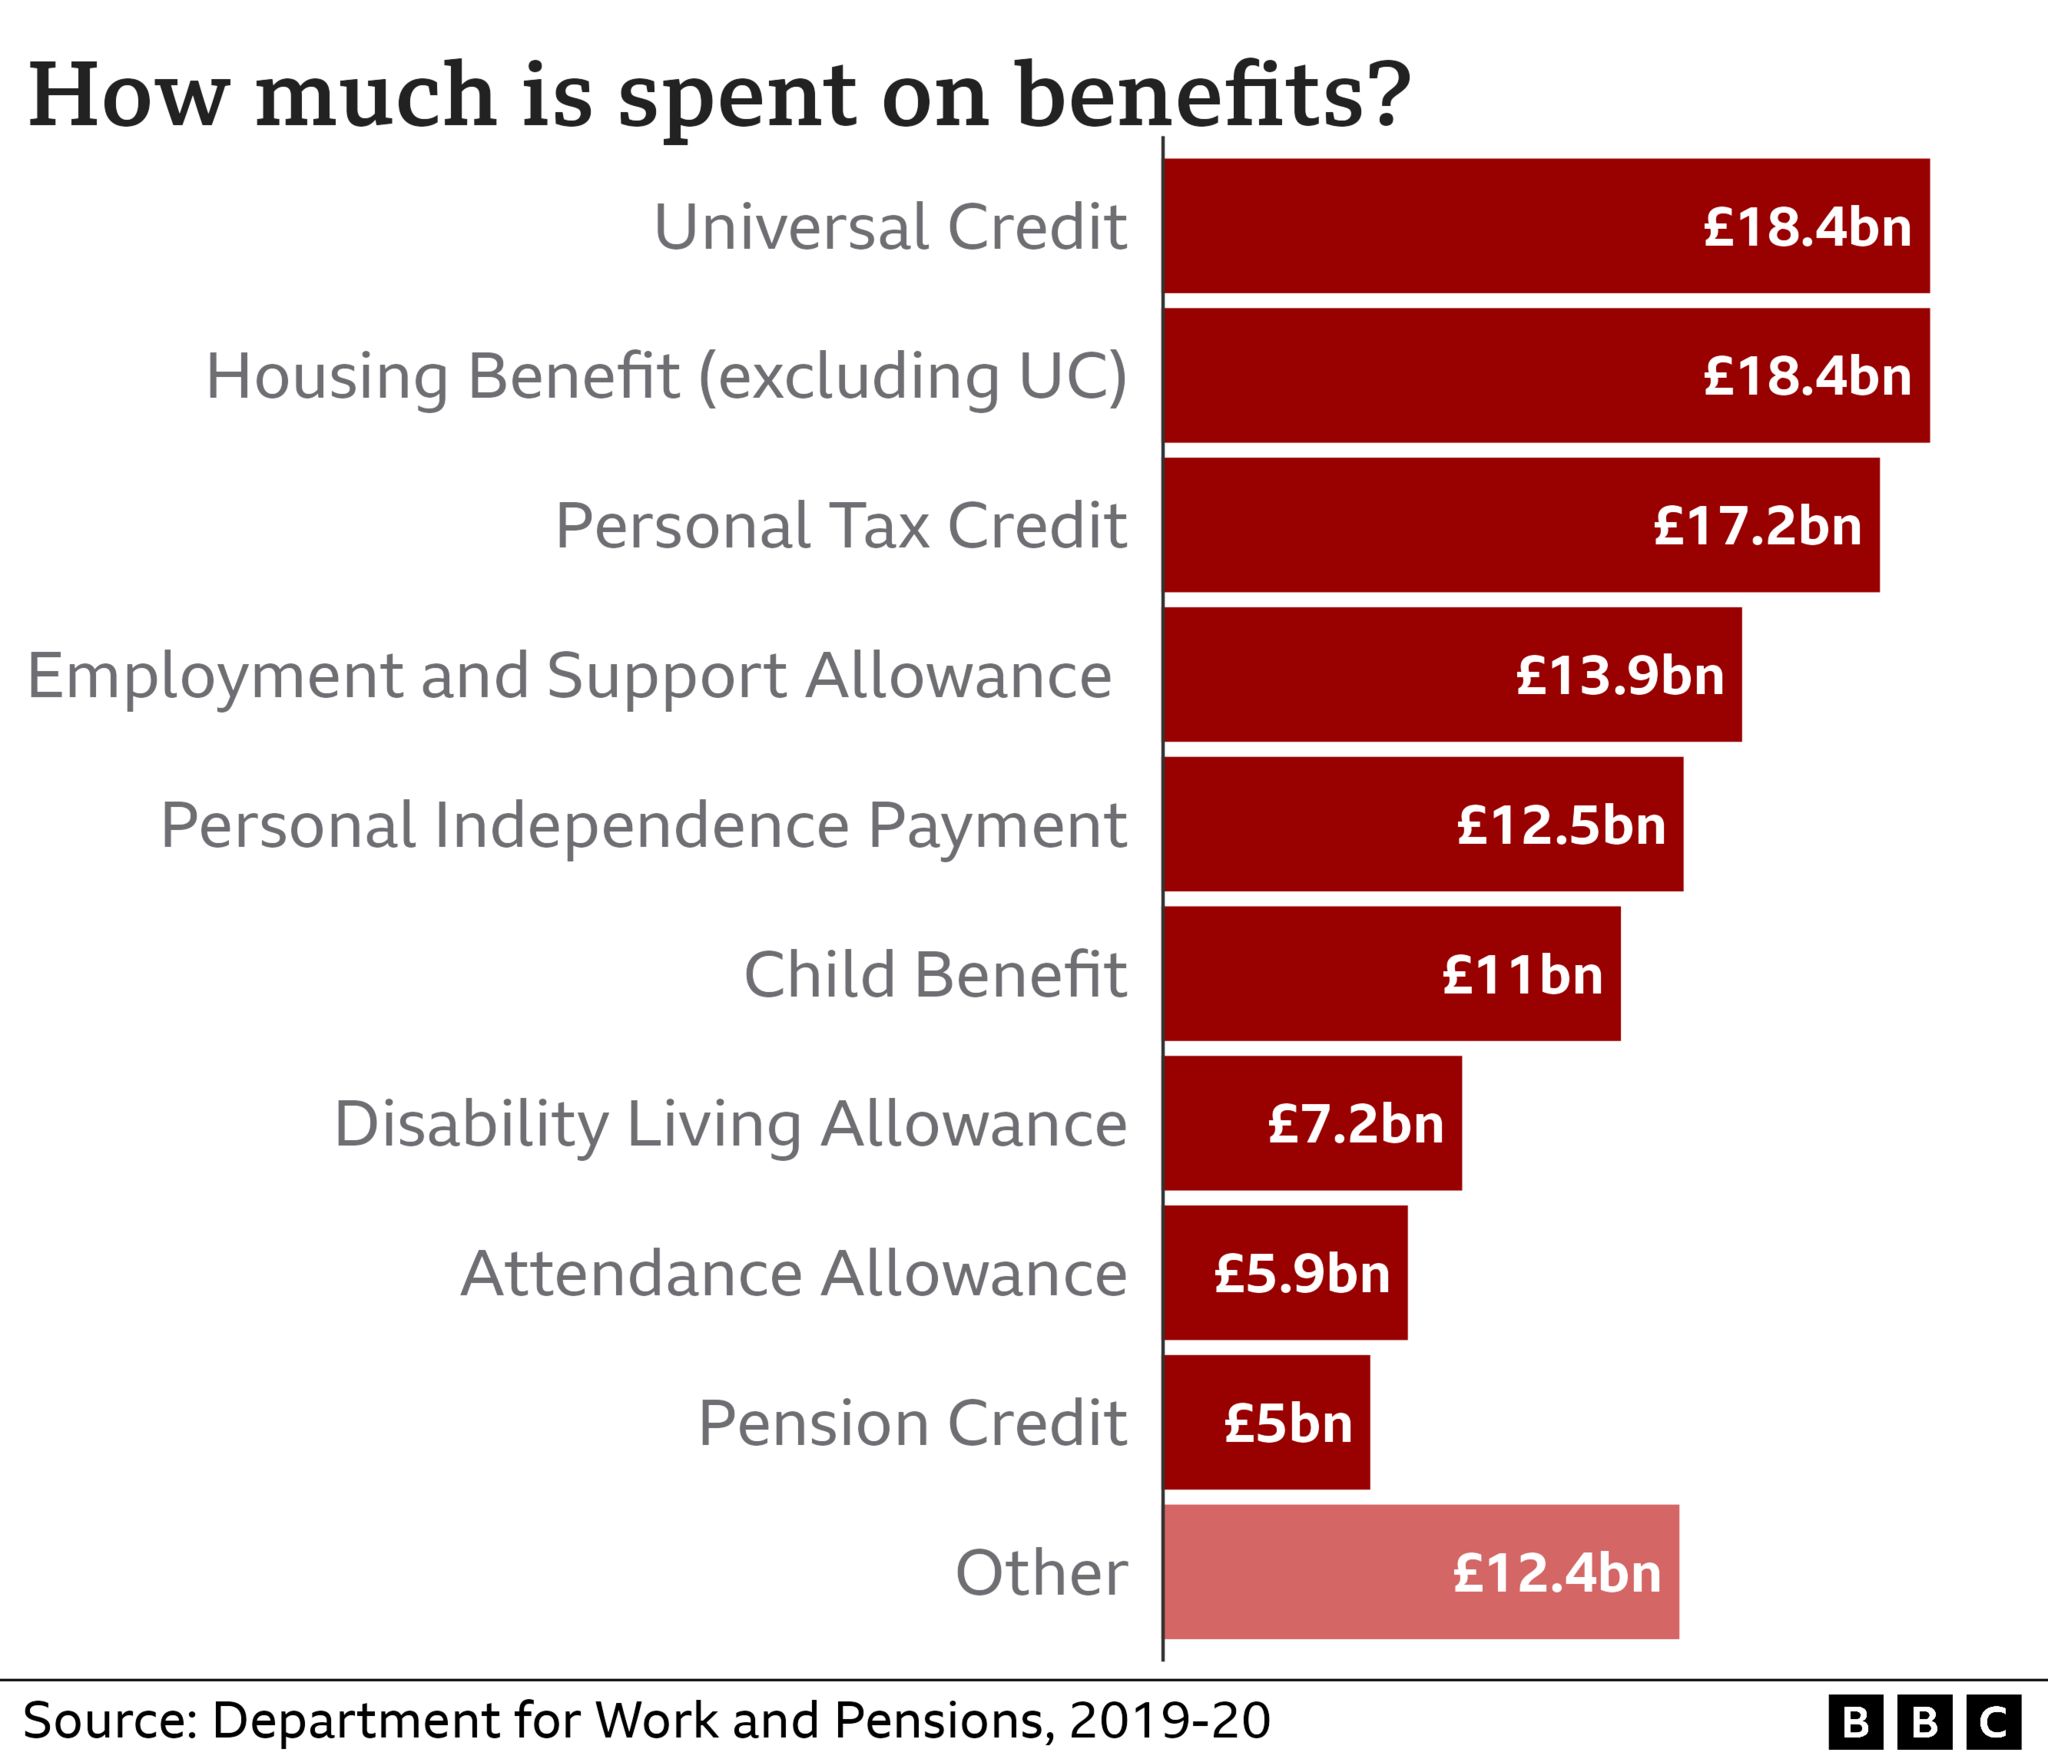
How much is spent on benefits?
In February, 22 million people were claiming some form of benefits, in England, Scotland and Wales.
In 2019-20, the year before the Covid pandemic, the government spent about £94bn on benefits.
In the same year, £99bn was spent on the state pension.
By comparison, the government spends almost £200bn per year on health and social care.
How much do benefits usually increase by?
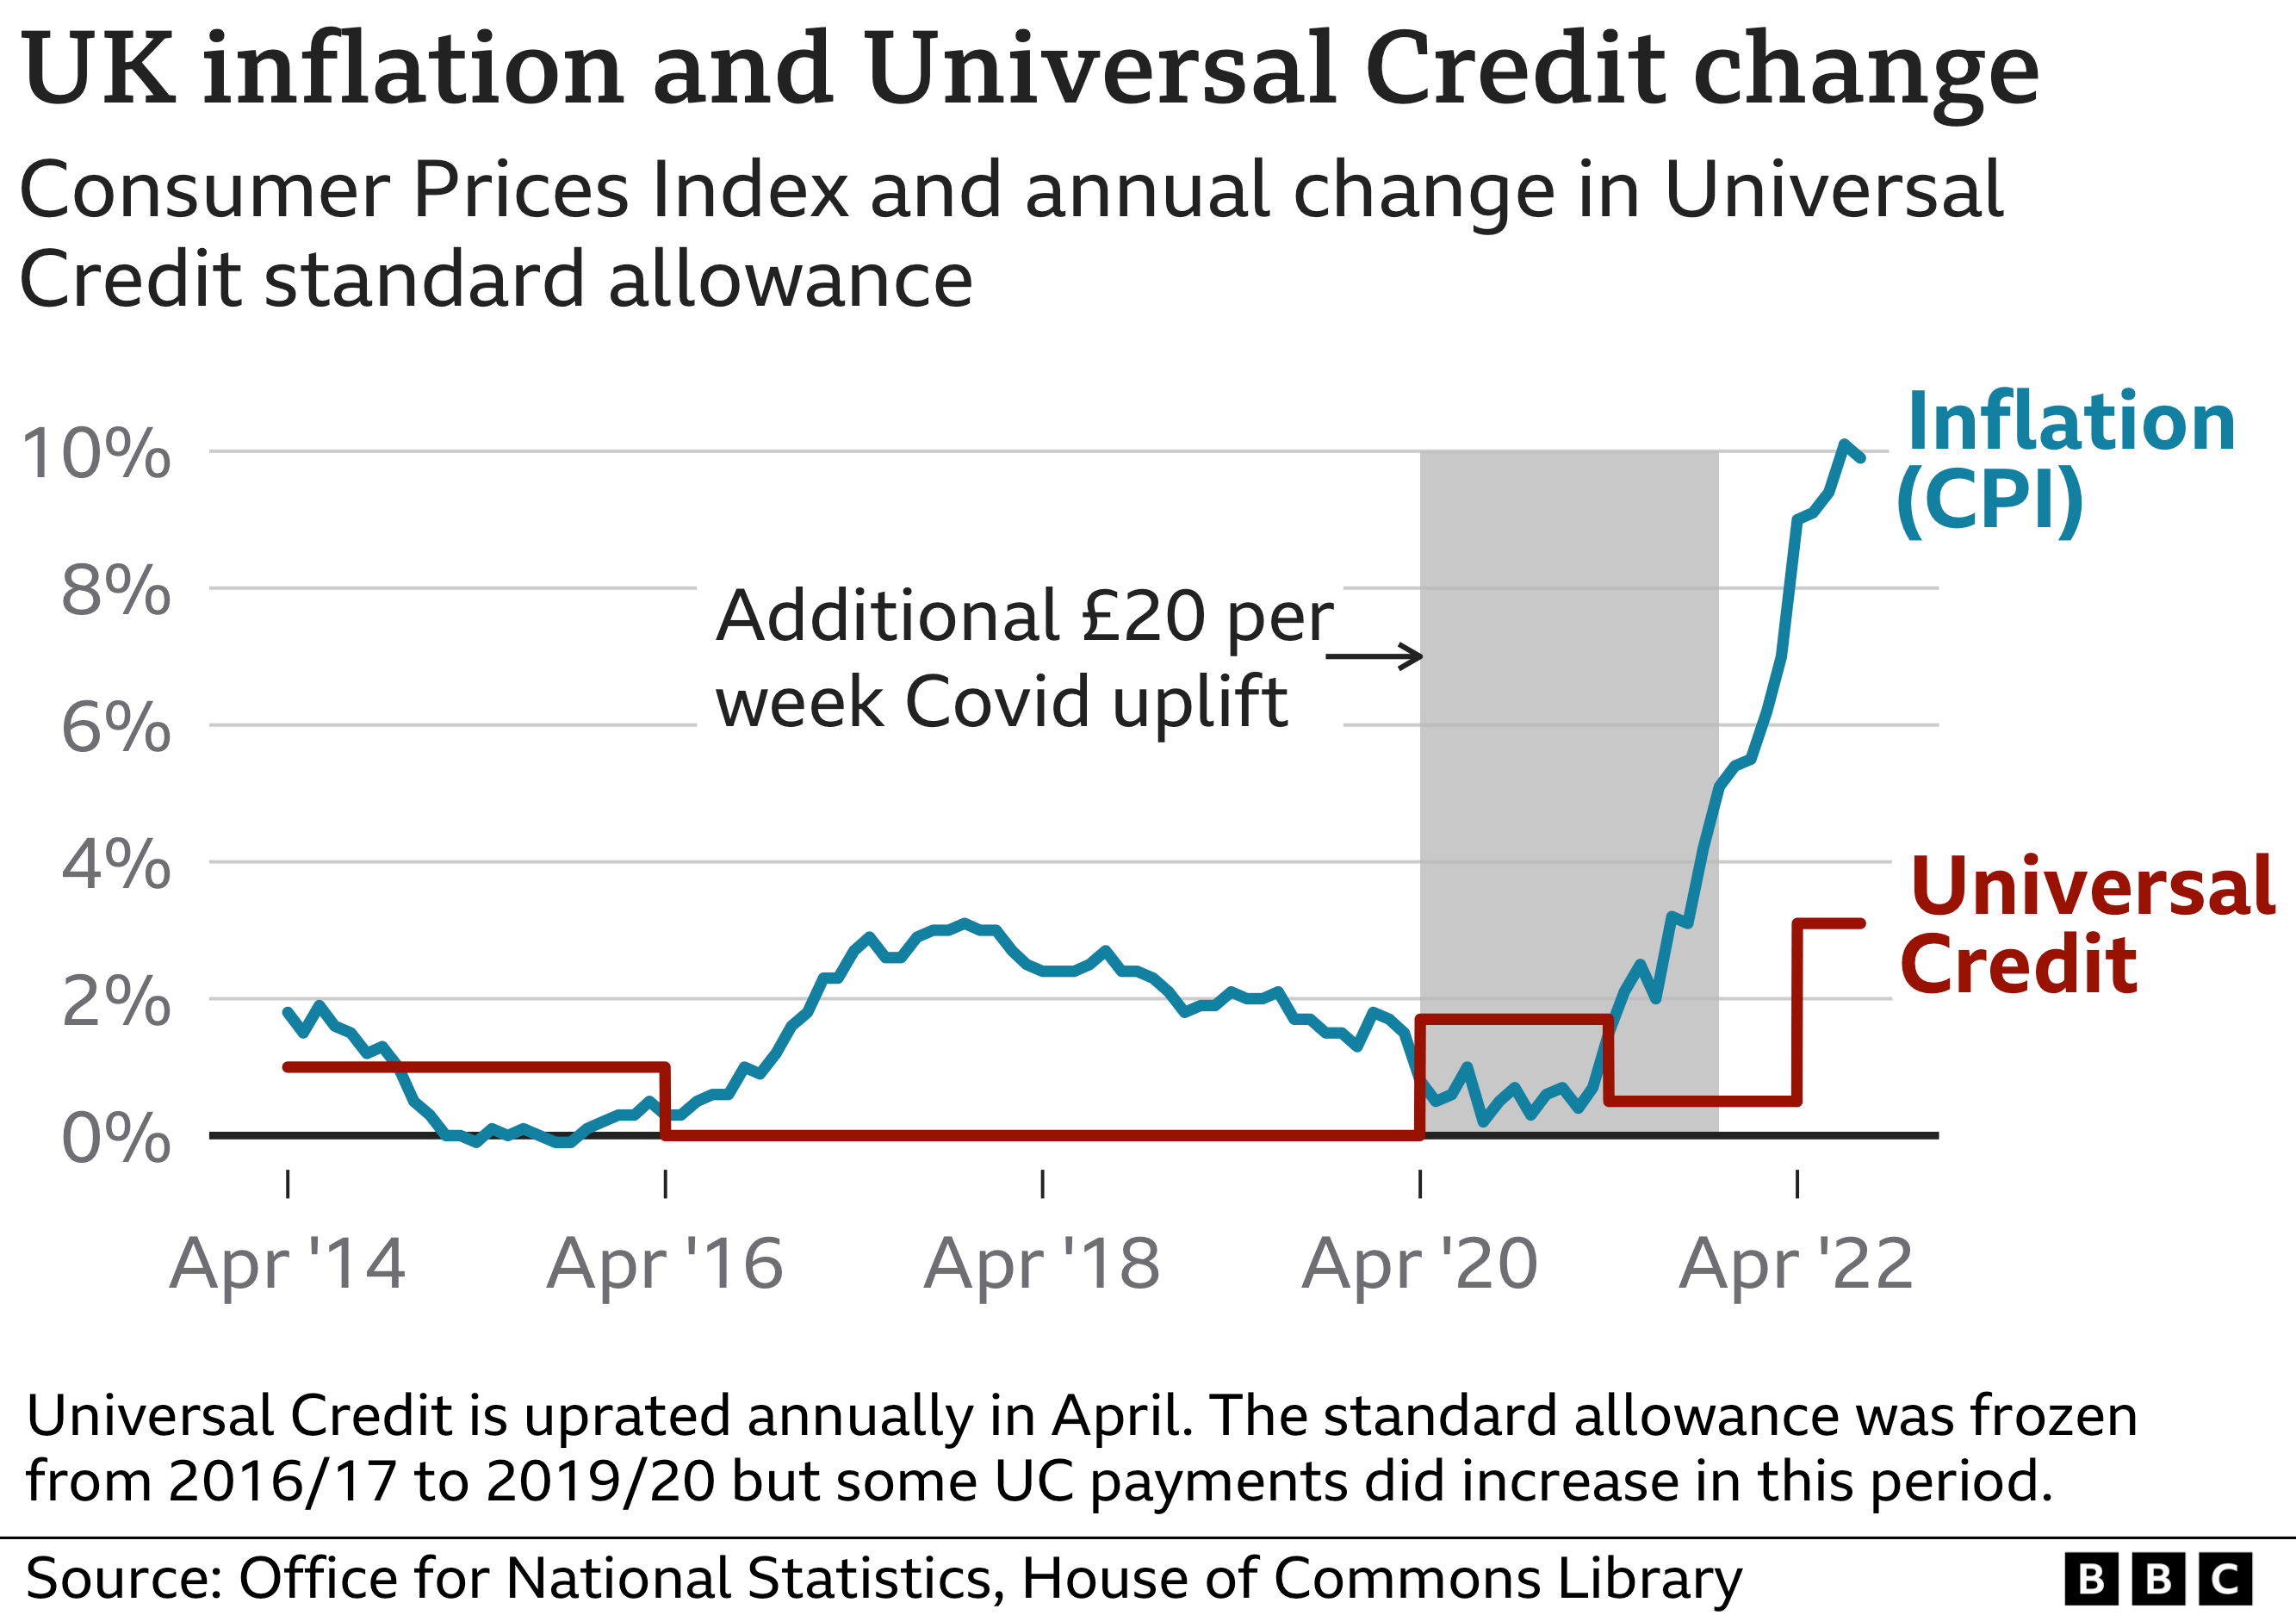
Most working-age benefits usually increase every April, in line with the previous September's inflation rate.
But between 2016 and 2020, most benefit increases were frozen.
If the government decides against raising benefits in line with inflation next year, it could instead increase them by the same proportion as average wages.
But this would represent a cut compared with the rising cost of living - and not apply to non-means-tested disability benefits, which under current law must rise in line with prices. This includes Personal Independence Payment.

When it comes to the state pension, Ms Truss has indicated she will maintain the triple lock, which ensures an annual rise to keep up with the rising cost of living - of either 2.5%, the rate of any increase in average earnings, or inflation, whichever is highest.
Universal credit
At £18.4bn, universal credit (UC) was the government's joint-highest benefit spend in 2019-20.
Claimed by 5.7 million people - about 41% of whom have jobs - UC is a monthly payment to help with living costs.
It was introduced to replace a number of existing benefits, including:
- child tax credit
- housing benefit
- income support
- income-based jobseeker's allowance
During the Covid pandemic, UC claimants received a temporary £20-a-week increase.

Housing benefit
In 2019-20, £18.4bn was spent on housing benefit, which helps people pay their rent.
In May 2022, there were 1.5 million working-age recipients and 1.1 million of pension age.
Housing benefit is gradually being replaced by UC.
Disability allowances
The main allowances for disabled people are:
- £13.9bn - employment-and-support allowance (ESA), which helps with living costs
- 12.5bn - personal independence payment (PIP), which helps with daily living costs and getting around
- £7.2bn - disability living allowance (DLA), which is in the process of being replaced, by PIP in England and Wales and adult disability payment in Scotland
- £5.9bn - attendance allowance which helps with extra costs to cover carers
In February there were:
- 1.7 million people claiming ESA
- 3.8 million people claiming either PIP or DLA
- 1.5 million attendance allowance claimants
Child benefit
The government spent £11.1bn on child benefit in 2019-20.
Since 2013, claimants earning more than £50,000 gradually have the benefit reduced the more they earn.
At £60,000 and above, child benefit is fully withdrawn.
And that figure has not been adjusted to reflect rising prices since then, meaning it now affects many more people.
In August 2021, 7.1 million families were receiving child benefit.
Personal tax credits
Child tax credit and working tax credit are being replaced by UC.
In 2019-20, the government spent £17bn on them but that is expected to fall to £7.5bn this year.
Pension Credit
Separate from the state pension, pension credit helps people over state-pension age with low incomes with living costs, at a cost of £5bn in 2019-20.
More than 1.4 million people currently receive pension credit, although the government says there are significantly more eligible pensioners who do not claim.
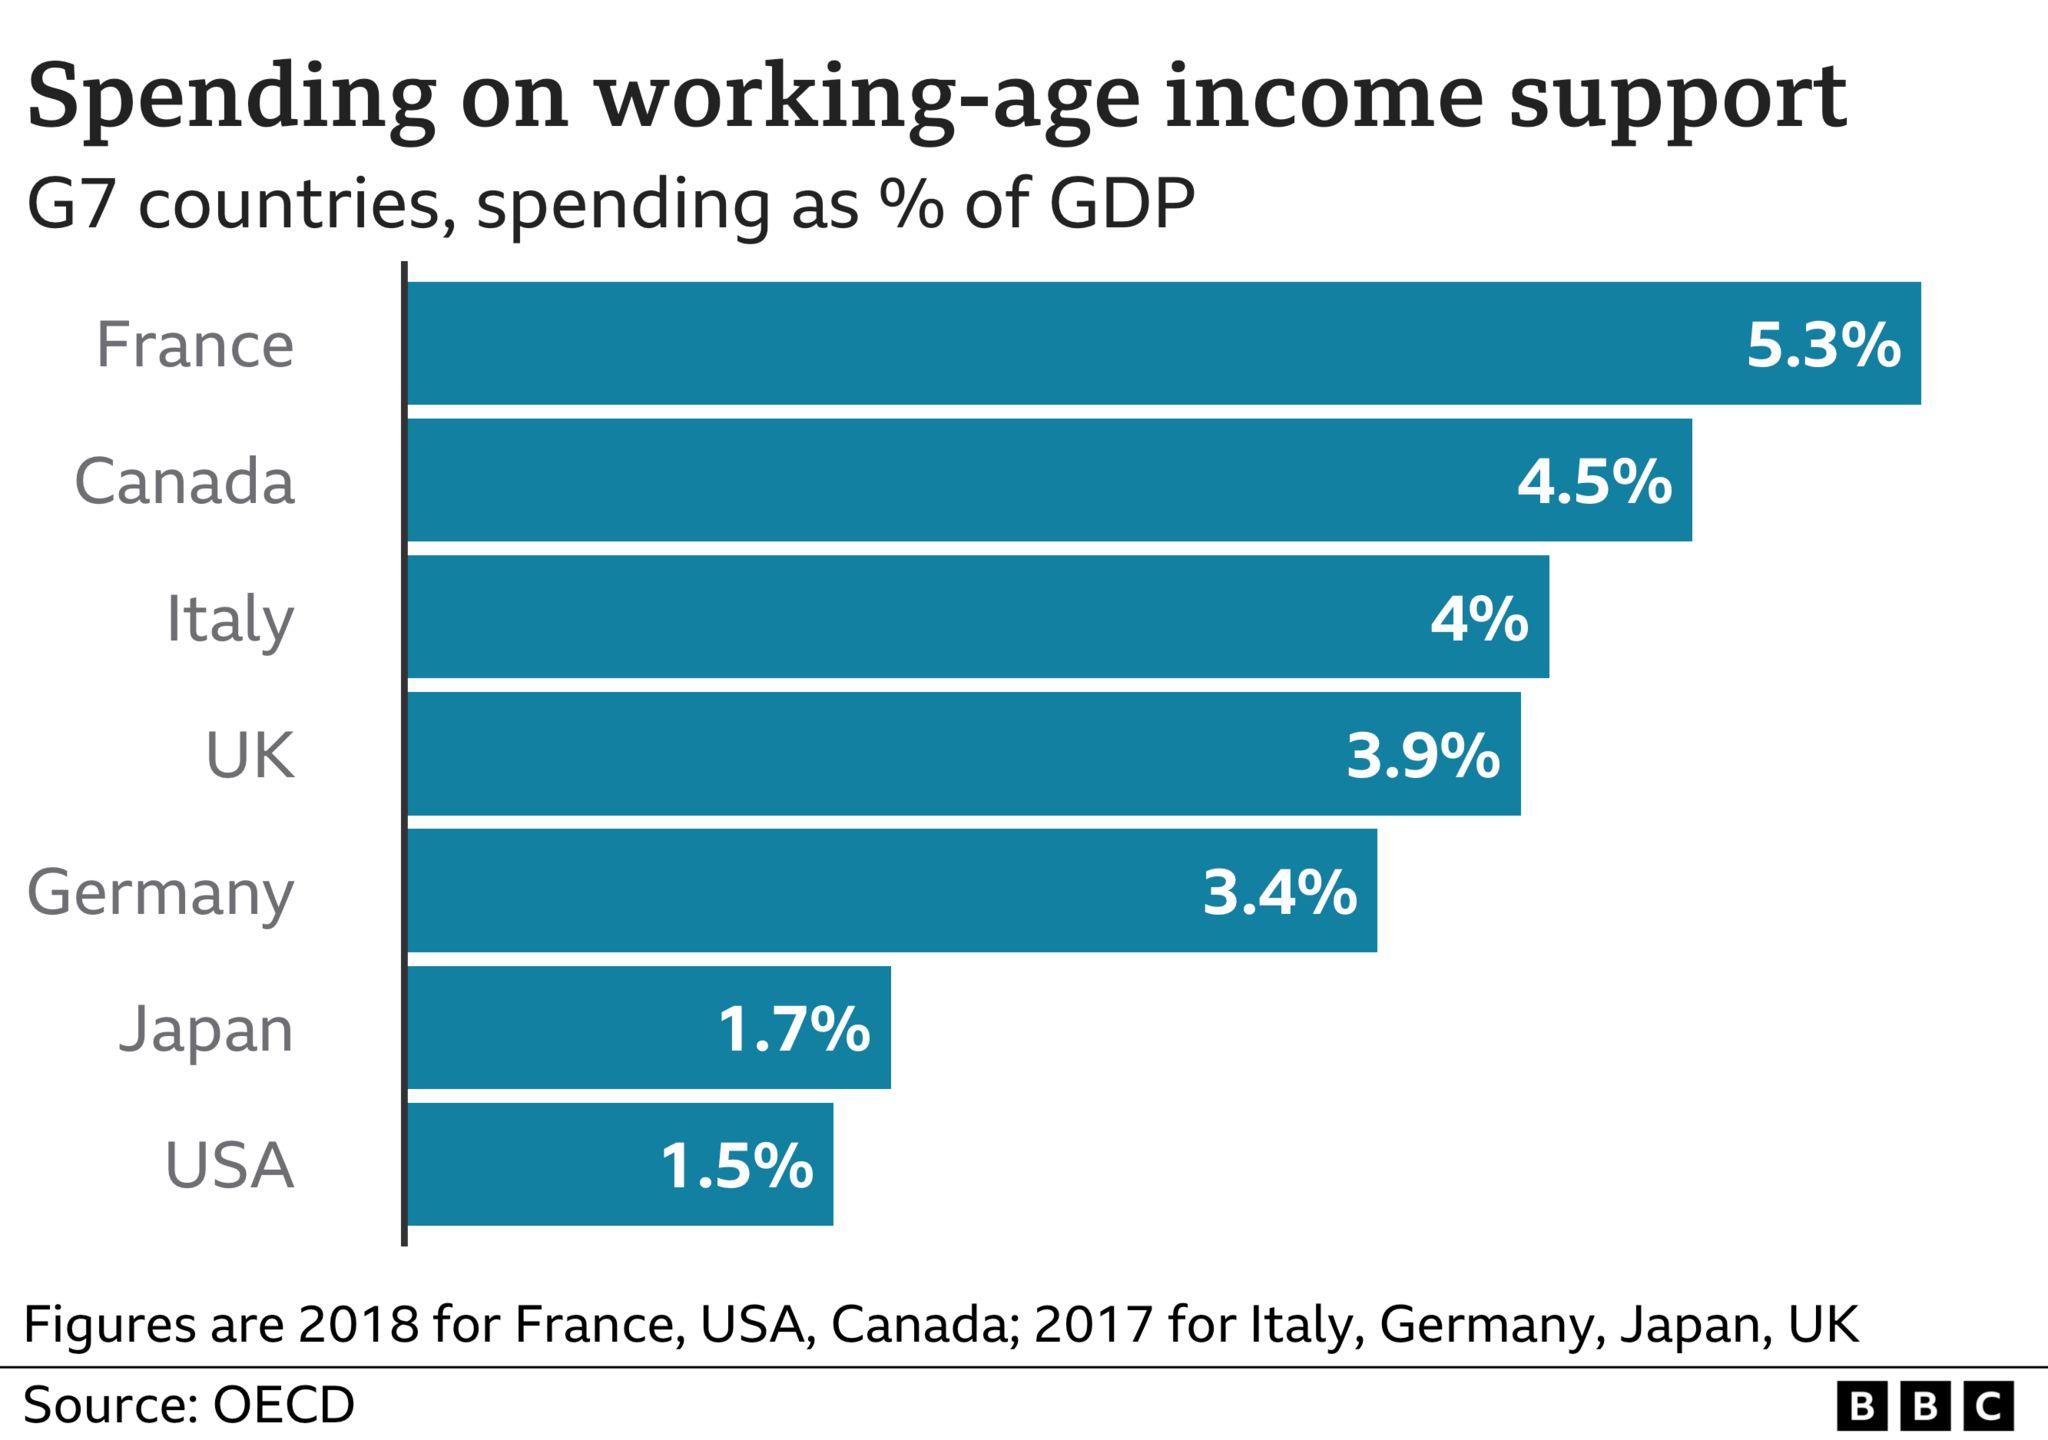
How does UK benefit spending compare with other countries?
The UK spends 3.9% of gross domestic product (GDP) - the total value of goods and services produced in the country - on working-age benefits, according to the latest data from the Organisation for Economic Co-operation and Development (OECD)

In a number of European countries, this proportion is higher.
Belgium tops the OECD list, at 6.4%, followed by Norway and Finland.
"The UK has one of the least generous out-of-work benefits systems for workers on average earnings in the OECD," the Institute for Fiscal Studies says.
https://news.google.com/__i/rss/rd/articles/CBMiLmh0dHBzOi8vd3d3LmJiYy5jby51ay9uZXdzL2V4cGxhaW5lcnMtNjMxMjk3MDXSATJodHRwczovL3d3dy5iYmMuY28udWsvbmV3cy9leHBsYWluZXJzLTYzMTI5NzA1LmFtcA?oc=5
2022-10-05 11:24:54Z
1585711038
Tidak ada komentar:
Posting Komentar